newsrafting
The Arkansas Through the Royal Gorge, 2026: A Season Below 500 cfs
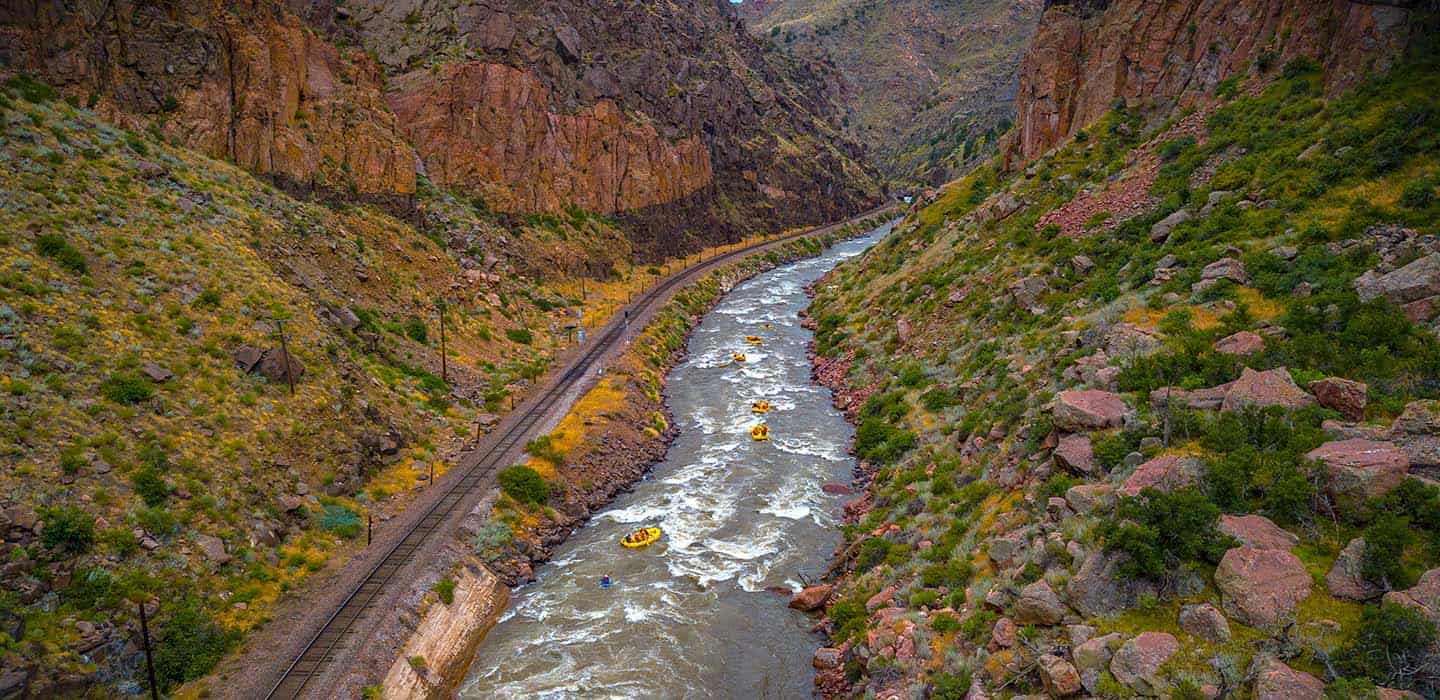
The Arkansas at the top of the Royal Gorge ran under 500 cfs on 161 of 162 days from April 15 to September 23, 2026. Here is the season month by month from the USGS gauge, set against a normal year, and what it means on a raft.
Royal Gorge GuideSeptember 24, 20264 min read
The short version
From April 15 to September 23, 2026, the Arkansas River at Parkdale, the USGS gauge at the top of the Royal Gorge, averaged under 500 cfs on 161 of 162 days. The only day above that line was May 16, at 524 cfs. The median daily flow for the season was 293 cfs. The spring headlines warned of a low year; the gauge shows how low.
Month by month
The daily average at Parkdale for each month: the median first, rounded to the nearest cfs, then the lowest and highest days.
- April, from the 15th: 357 cfs, ranging from 255 cfs to 376 cfs.
- May: 366 cfs, ranging from 283 cfs to 524 cfs.
- June: 403 cfs, ranging from 273 cfs to 484 cfs.
- July: 251 cfs, ranging from 204 cfs to 389 cfs.
- August: 259 cfs, ranging from 198 cfs to 390 cfs.
- September, to the 23rd: 237 cfs, ranging from 178 cfs to 343 cfs.
Against a normal year
USGS also publishes the median flow for each calendar day across the gauge's record, which starts in 1946. Set against it, 2026 began like an ordinary year, and then the June rise never came.
- April 15: 360 cfs, against a long-term median of 352 cfs.
- May 15: 479 cfs, against 804 cfs.
- June 1: 403 cfs, against 1,690 cfs.
- June 15: 484 cfs, against 2,260 cfs.
- July 15: 223 cfs, against 1,280 cfs.
- August 15: 280 cfs, against 867 cfs.
- September 15: 188 cfs, against 431 cfs.
In a typical year the river climbs from about 352 cfs in mid-April to about 2,260 cfs by mid-June. In 2026 its highest day was 524 cfs, and by mid-July it was running at about a sixth of its usual level for the date. The medians for April 15 and May 15 cover 72 years of records, 1946 to 2026; the rest cover 71 years, 1946 to 2025.
What low water changes on a trip
Guides on the Arkansas read the river in cubic feet per second. Under 500 cfs the river is low: rocks show, lines get technical and guides pick their way through, so the ride is precise rather than big. Between 500 and 2,000 cfs is the range most groups find ideal, and over 2,000 cfs brings bigger waves and faster water. In 2026 the river sat in the low band almost every day. Low water is not a closed river; it is a different ride, and the guide picks the line through each rapid for the level that day.
What fall water looks like
Low water in the fall is normal. The long-term median for September 15 at Parkdale is 431 cfs, under the 500 cfs line in an ordinary year. On September 15, 2026 the river ran 188 cfs, and the lowest day of the season so far was September 13, at 178 cfs.
How to read the Parkdale gauge
The gauge is USGS 07094500, the Arkansas River at Parkdale, at the top of the canyon, and it reports about every 15 minutes. Discharge, in cfs, is how much water is moving; gauge height, in feet, is how high the surface sits at the gauge. The figures in this post are daily averages. The reading you see on the day is the latest one, and it can move by the hour. USGS marks the figures from June 1 on as provisional, which means they can still be revised.
Our river conditions page reads the gauge live and says which band the river is in. The full record is on the USGS gauge page. Your outfitter will tell you what the day's trip looks like at that level.
Tags
royal gorgearkansas riverriver conditionslow waterraftingusgs gauge
Related Articles
 news
newsThe Royal Gorge in a Low-Water Year: What the 2026 News Actually Said
The spring 2026 headlines said Colorado rafting was in trouble. The same reporting said the Arkansas season would go ahead and that the Royal Gorge, low on the river, would see more traffic. Here is what was said, and how to check the river yourself.
September 24, 2026
Learn more
 rafting
Royal Gorge Rafting Seasons: What Changes Month to Month
Understanding how the Arkansas River changes through the year can help you choose the right time for your rafting adventure. Here's what to expect each season.
Learn more
 safety
Safety Basics for River Activities
The Arkansas River demands respect. Here's what you should know before getting on the water.
Learn more